Hello everyone!
Today I wanted to discuss how I’m keeping track of Fail2ban logs on my Proxmox cluster.
For those of you who don’t know what Fail2ban is, it is a simple program that can automatically ban threats via iptables by parsing log files and scanning for regex patterns.
Here is a sample file that can be parsed:
[Definition]
failregex = pvedaemon\[.*authentication failure; rhost=<HOST> user=.* msg=.*
ignoreregex =
And here is the the jail configuration:
[proxmox]
enabled  = true
port     = https,http,8006
filter   = proxmox
logpath  = /var/log/daemon.log
maxretry = 3
Essentially what this means is that any time Fail2ban sees a log matching the expression above in (/var/log/daemon.log), it will evaluate the rules it has in place and ban any IPs that show up multiple times.
In my cluster, for example, you can only attempt logging into Proxmox three times via the web UI before you’re banned from that IP address.
While this won’t stop an individual from using a VPN to attempt attacking again, it will cut down on any threats that are using automation or bots. It’s very popular to use with SSH, for example, as there are plenty of bots on the internet looking to use your servers as a cryptominer.
Here is an example of some of the jails I have set up, and the IPs that are banned.
root@pve:~# fail2ban-client status sshd
Status for the jail: sshd
|- Filter
|  |- Currently failed: 2
|  |- Total failed:     22982
|  `- Journal matches:  _SYSTEMD_UNIT=sshd.service + _COMM=sshd
`- Actions
   |- Currently banned: 8
   |- Total banned:     2468
   `- Banned IP list:   116.193.190.134 115.190.64.245 103.38.54.223 122.53.133.167 45.119.212.99 165.154.200.14 103.176.78.178 119.45.40.108

root@pve:~# fail2ban-client status proxmox
Status for the jail: proxmox
|- Filter
|  |- Currently failed: 0
|  |- Total failed:     204
|  `- Journal matches:
`- Actions
   |- Currently banned: 0
   |- Total banned:     68
   `- Banned IP list:
You can check these IPs on AbuseIPDB, many have been reported.
Having Fail2ban is nice because it’s good old-fashioned security. I know I’m protected against brute-force attacks, and having strong passwords plus password SSH disabled on my servers means I’m not susceptible to SSH backdoor attacks. But… needing a visual on my network is not just about having a service running on my nodes, it’s also about having visibility into how often someone is knocking on my door.
This is where Grafana and Loki come in. Grafana and Loki are used for everything from creating dashboards of your server health to aggregating syslogs from multiple servers into a single point of view. In my use case, I was curious about using Grafana + Loki to get a visual on how often Fail2ban is banning IPs and to monitor any spikes.
The setup went something like this:
- Setup
syslog-ngon my Proxmox cluster hosts. - Setup
Grafana + Loki + Alloy. - Forward syslogs to my monitoring server and tail them with
Alloywhich forwards them toLoki. - Create cool dashboards!
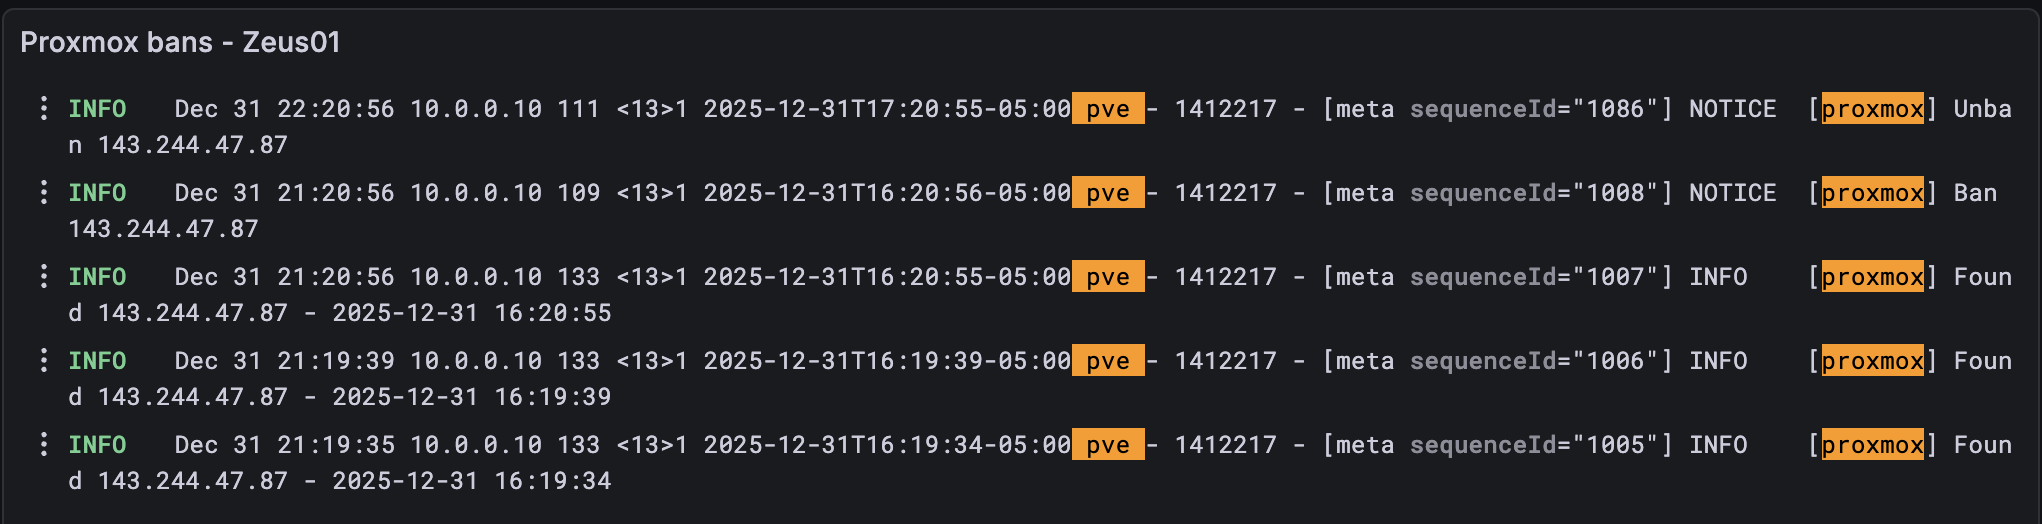
I might cover the setup in another post, but the end result is the following graphs:
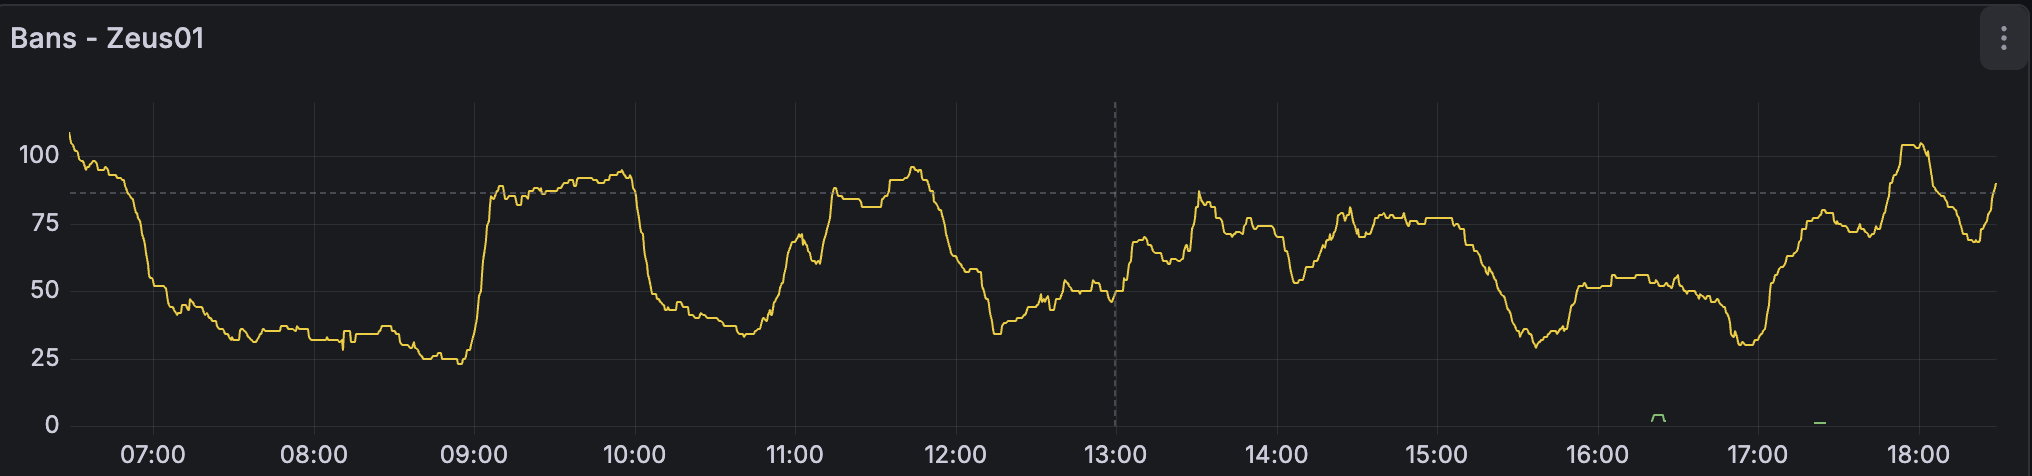

I also have this setup for each host in my environment. I’m able to aggregate all my logs in a nice dashboard as well as have a time-series graph showing me any spikes. I can also create a view for all the hosts in my environment, if needed, but I find having the individual dashboards easier to see spikes and other anomalies.
Observability is huge, especially for any security focused engineers!